|
|
 |
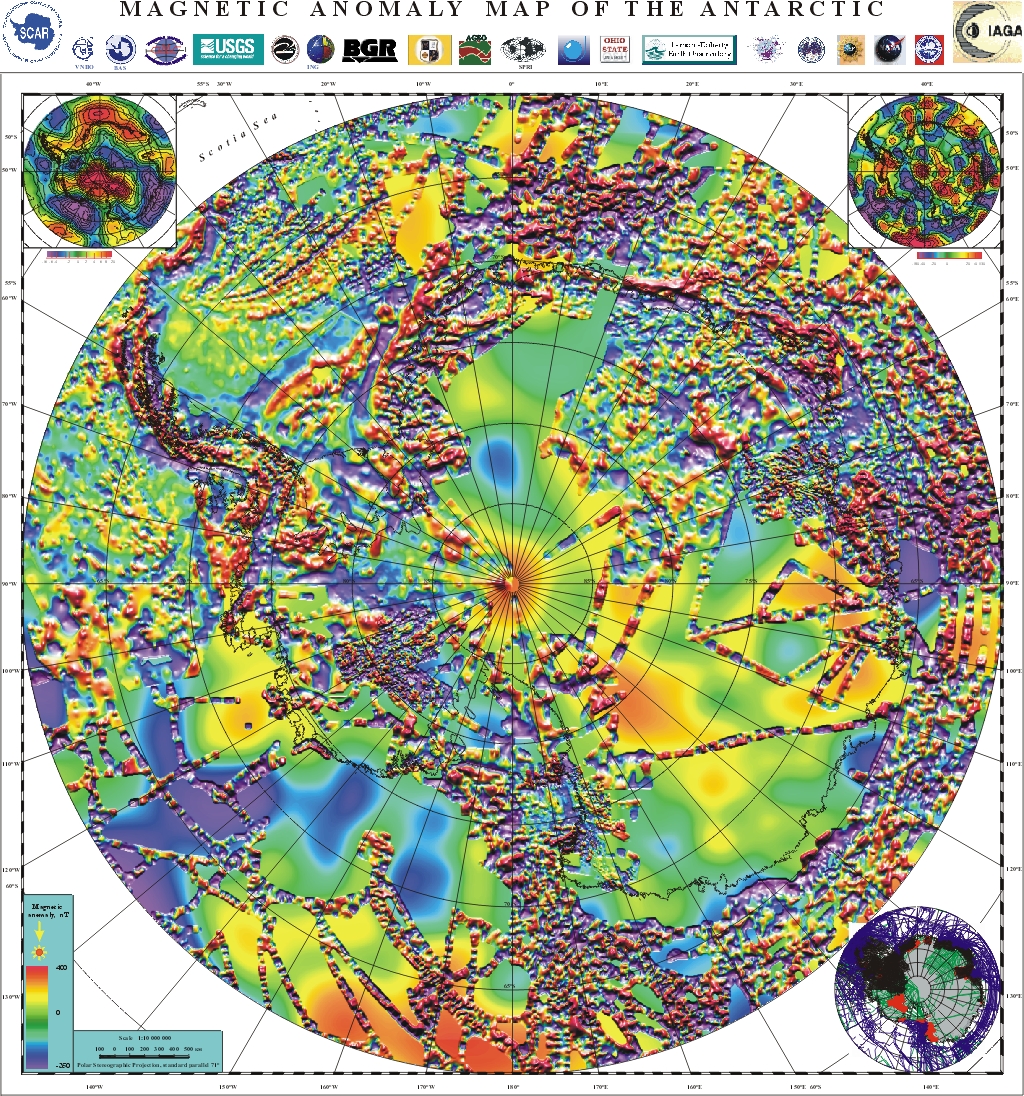
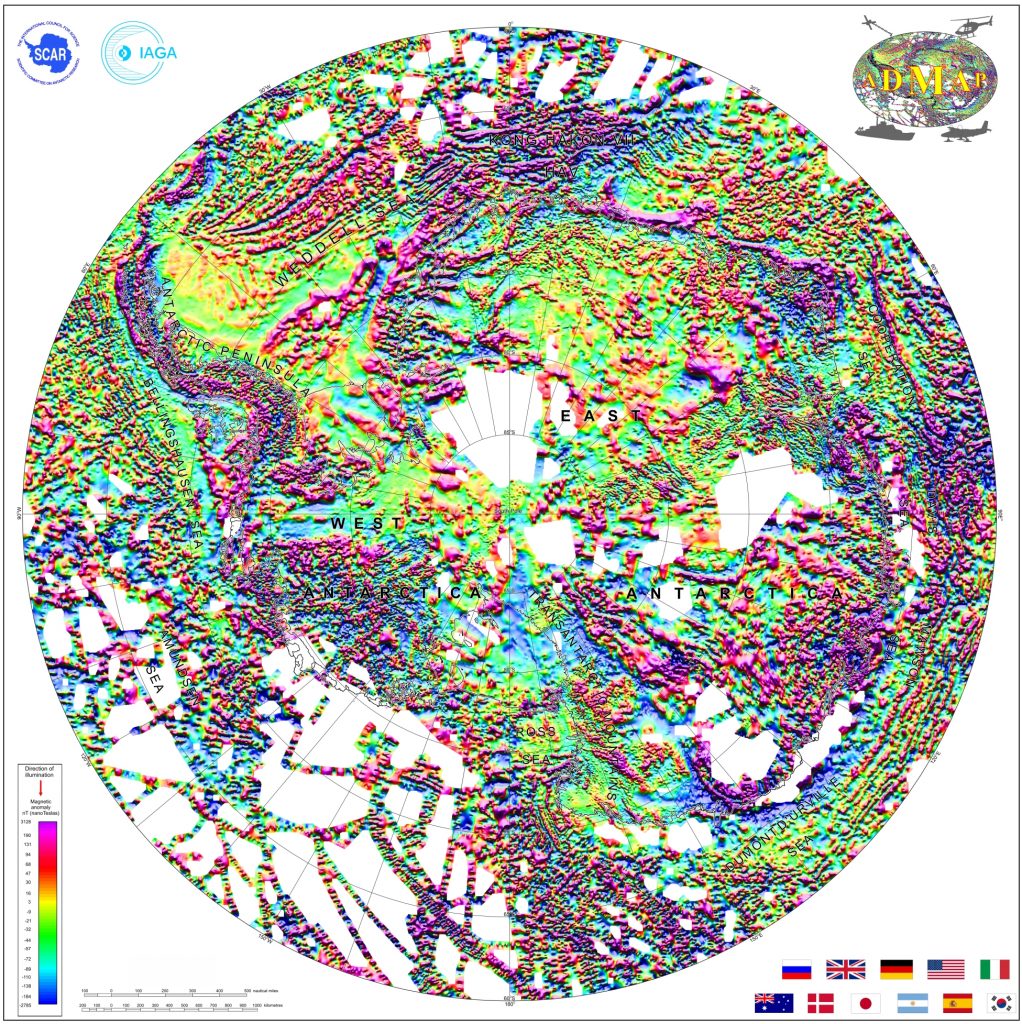
ADMAP -2
|
|
 This new map which
includes 3.5 million line-km of magnetic anomaly
data collected over the past 50 years, sheds new
light on the structure and evolution of the
Antarctic continent and its surrounding
oceans. Details about this map was
described in Golynsky
and ADMAP colleagues in GRL.(2018). This new map which
includes 3.5 million line-km of magnetic anomaly
data collected over the past 50 years, sheds new
light on the structure and evolution of the
Antarctic continent and its surrounding
oceans. Details about this map was
described in Golynsky
and ADMAP colleagues in GRL.(2018).
|
|
|
|
 The
data grid (gdb format) for this map is available at
this website
(PANGAEA data publisher for
Earth Sciences) The
data grid (gdb format) for this map is available at
this website
(PANGAEA data publisher for
Earth Sciences)
|
|
 The
magnetic equivalent point source (EPS) array
(related to ADMAP-2s) can be downloaded The
magnetic equivalent point source (EPS) array
(related to ADMAP-2s) can be downloaded
* zipped magnetic point source model (~1.02 Mb) at here
* computer codes and README file (zipped, written by
Matlab) to estimate the predictions from the EPS
model at here
|
|
|
 |
ADMAP -
CNSCO-GEST06
|
|
 This map was generated using
ADMAP near-surface compilation, Orsted and
CHAMP satellite total intensity anomaly data (Kim et al., 2007) at 400 and 700 km,
respectively. The surface gaps were
augmented by the algorithm in Kim et al. (2004) for the wavelengths
larger than 400 km. Details about this map
was described in Kim et al.(2004, 2007). This map was generated using
ADMAP near-surface compilation, Orsted and
CHAMP satellite total intensity anomaly data (Kim et al., 2007) at 400 and 700 km,
respectively. The surface gaps were
augmented by the algorithm in Kim et al. (2004) for the wavelengths
larger than 400 km. Details about this map
was described in Kim et al.(2004, 2007). |
|
|
|
The data grid
for this map is available at here
( ascii zipped. 34 Mb) .....
|
|
|
|
ADMAP - CNSO-OSU02
|
|
 This map
was generated using ADMAP near-surface compilation
and Orsted satellite total intensity anomaly data (Kim, 2002) at
700 km. The surface gaps were augmented by the
algorithm in Kim
et al.
(2004) for the wavelengths larger than 400 km.
Details about this map was described in Kim et al.(2004). This map
was generated using ADMAP near-surface compilation
and Orsted satellite total intensity anomaly data (Kim, 2002) at
700 km. The surface gaps were augmented by the
algorithm in Kim
et al.
(2004) for the wavelengths larger than 400 km.
Details about this map was described in Kim et al.(2004).
|
|
|
|
The data grid
for this map is available at here
( ascii zipped. 4.2 Mb) |
|
|
|
|
| |
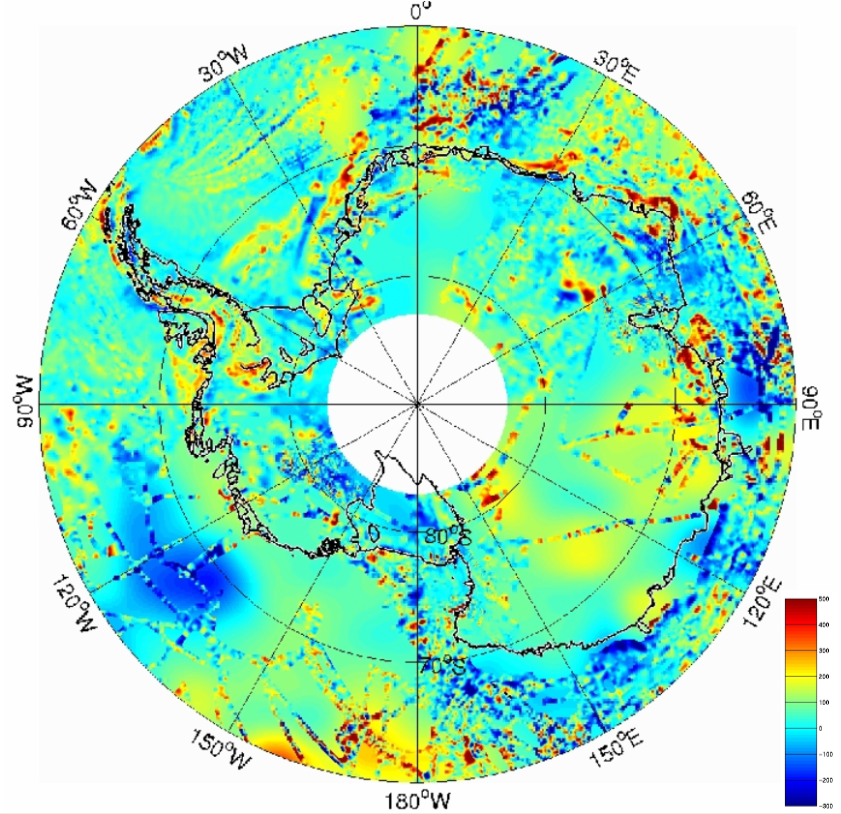
ADMAP - 2001
|
|
 This map was generated
using ADMAP near-surface compilation and Magsat
satellite total intensity anomaly data at 400
km. The surface gaps were augmented by
equivalent point diple source technique for the
wavelengths larger than 400 km. This map was generated
using ADMAP near-surface compilation and Magsat
satellite total intensity anomaly data at 400
km. The surface gaps were augmented by
equivalent point diple source technique for the
wavelengths larger than 400 km. |
|
|
|
The data
grid (5 km interval) for this map is available here
( ascii zipped. 14.6MB) |
|
|
|
The image file
for this map is also available at here
(Corel Draw zipped. 28 Mb) |
|
|
|
The survey
files used to produce this map are available at here
(ascii zipped. 191 Mb) |
|
|
|
|
|
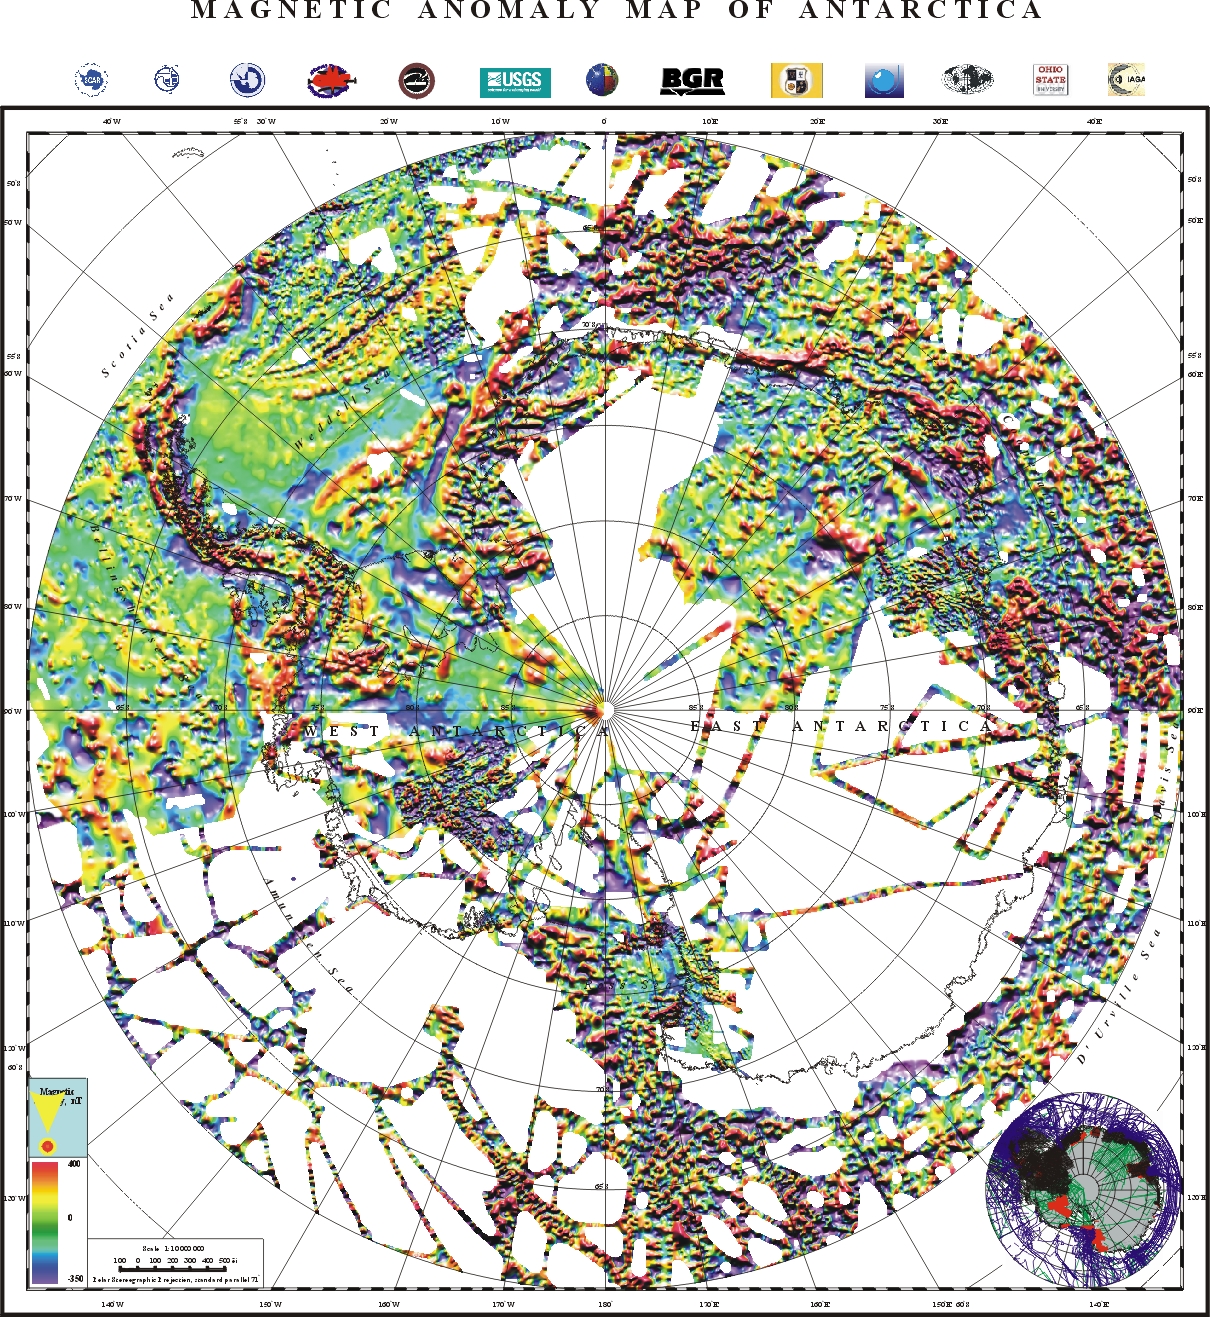
ADMAP - 2001
|
|
 This map was generated
using ADMAP near-surface compilation data collected
by all ADMAP WG and finalized by Dr. Golynsky
(Golynsky et al., 2002) This map was generated
using ADMAP near-surface compilation data collected
by all ADMAP WG and finalized by Dr. Golynsky
(Golynsky et al., 2002)
|
|
|
|
The data grid (5
km interval) for this map is available at here
( ascii zipped. 14.6 Mb) |
|
|
|
The image file
for this map is also available at here
(Corel Draw zipped. 28 Mb) |
|
|
